Parallax Product Strategy & Vision
Project Summary
When I first was hired, we only had a UI kit. I pulled together a cohesive and accessible style guide for the team. We later transitioned it from Sketch+Invision to Figma. Next, we came up with proto-archetypes and validated them through customer interviews. This solidified our foundation. I was tasked with creating a product vision. We needed a simple story to tell our internal team, prospects, and customers to show how we can help them become more operationally mature. Lastly, we considered archetypes in our implementation process. We prioritized stories that would be the most beneficial for the least amount of effort.

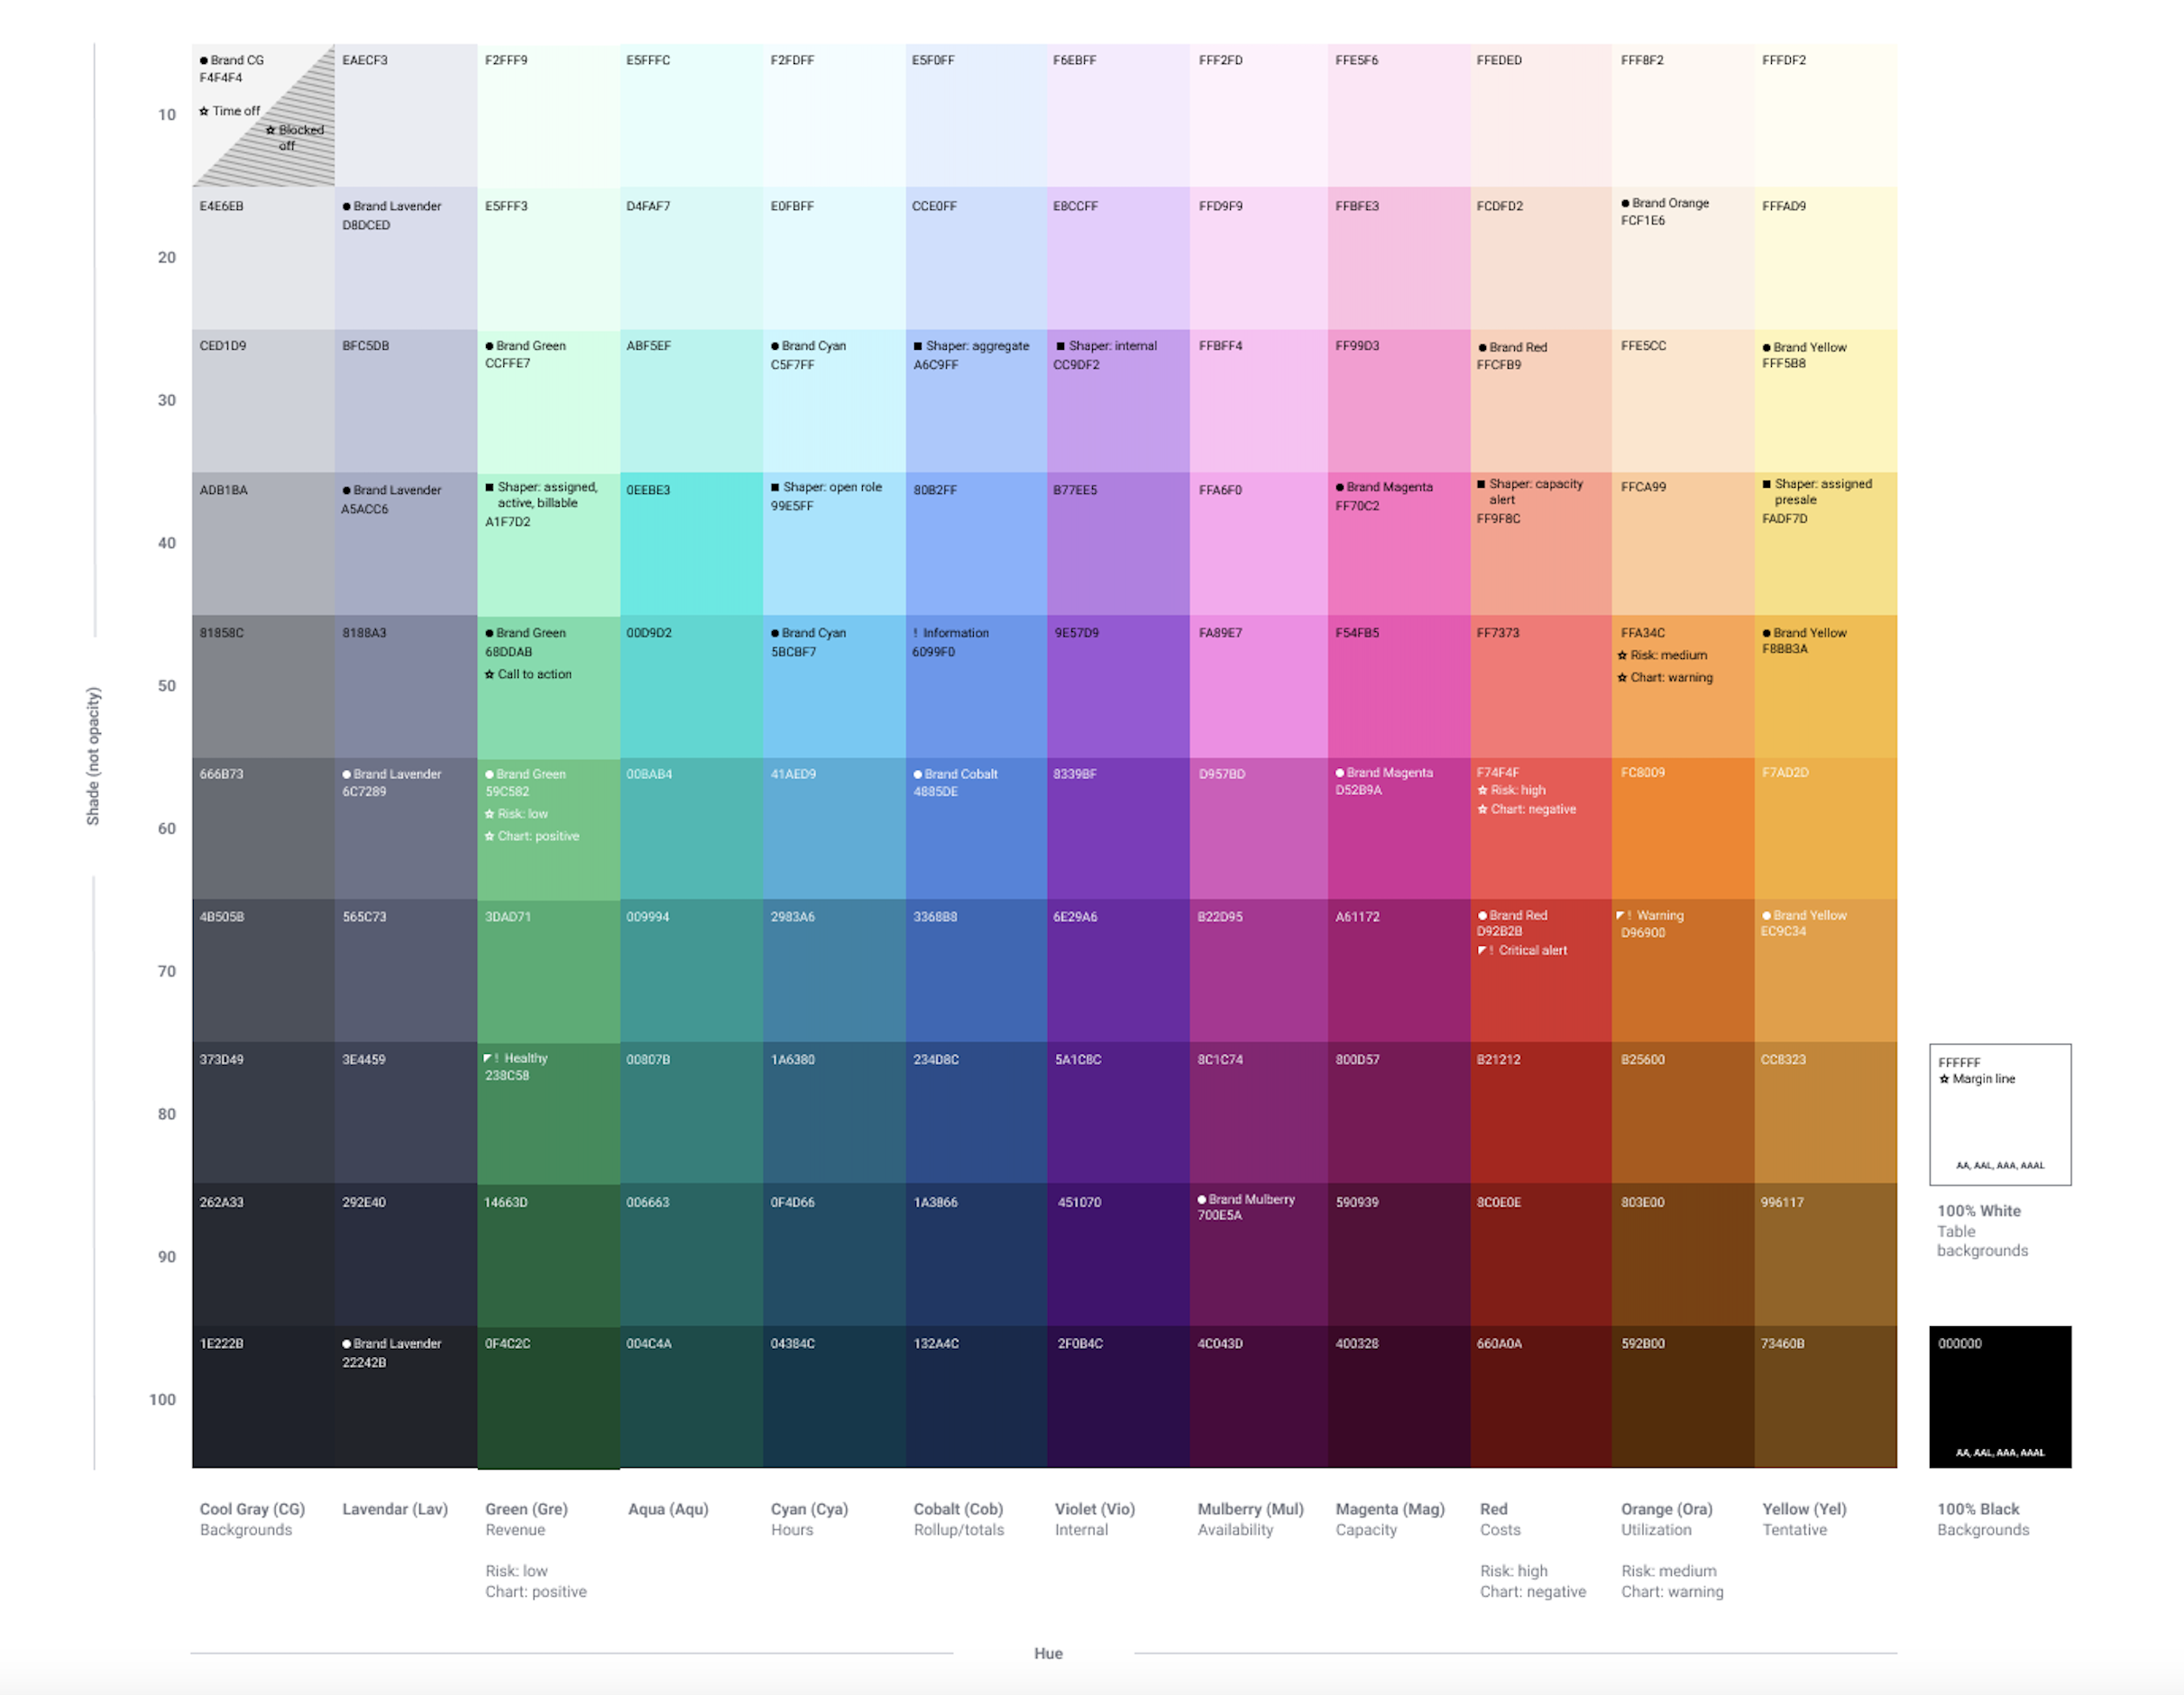
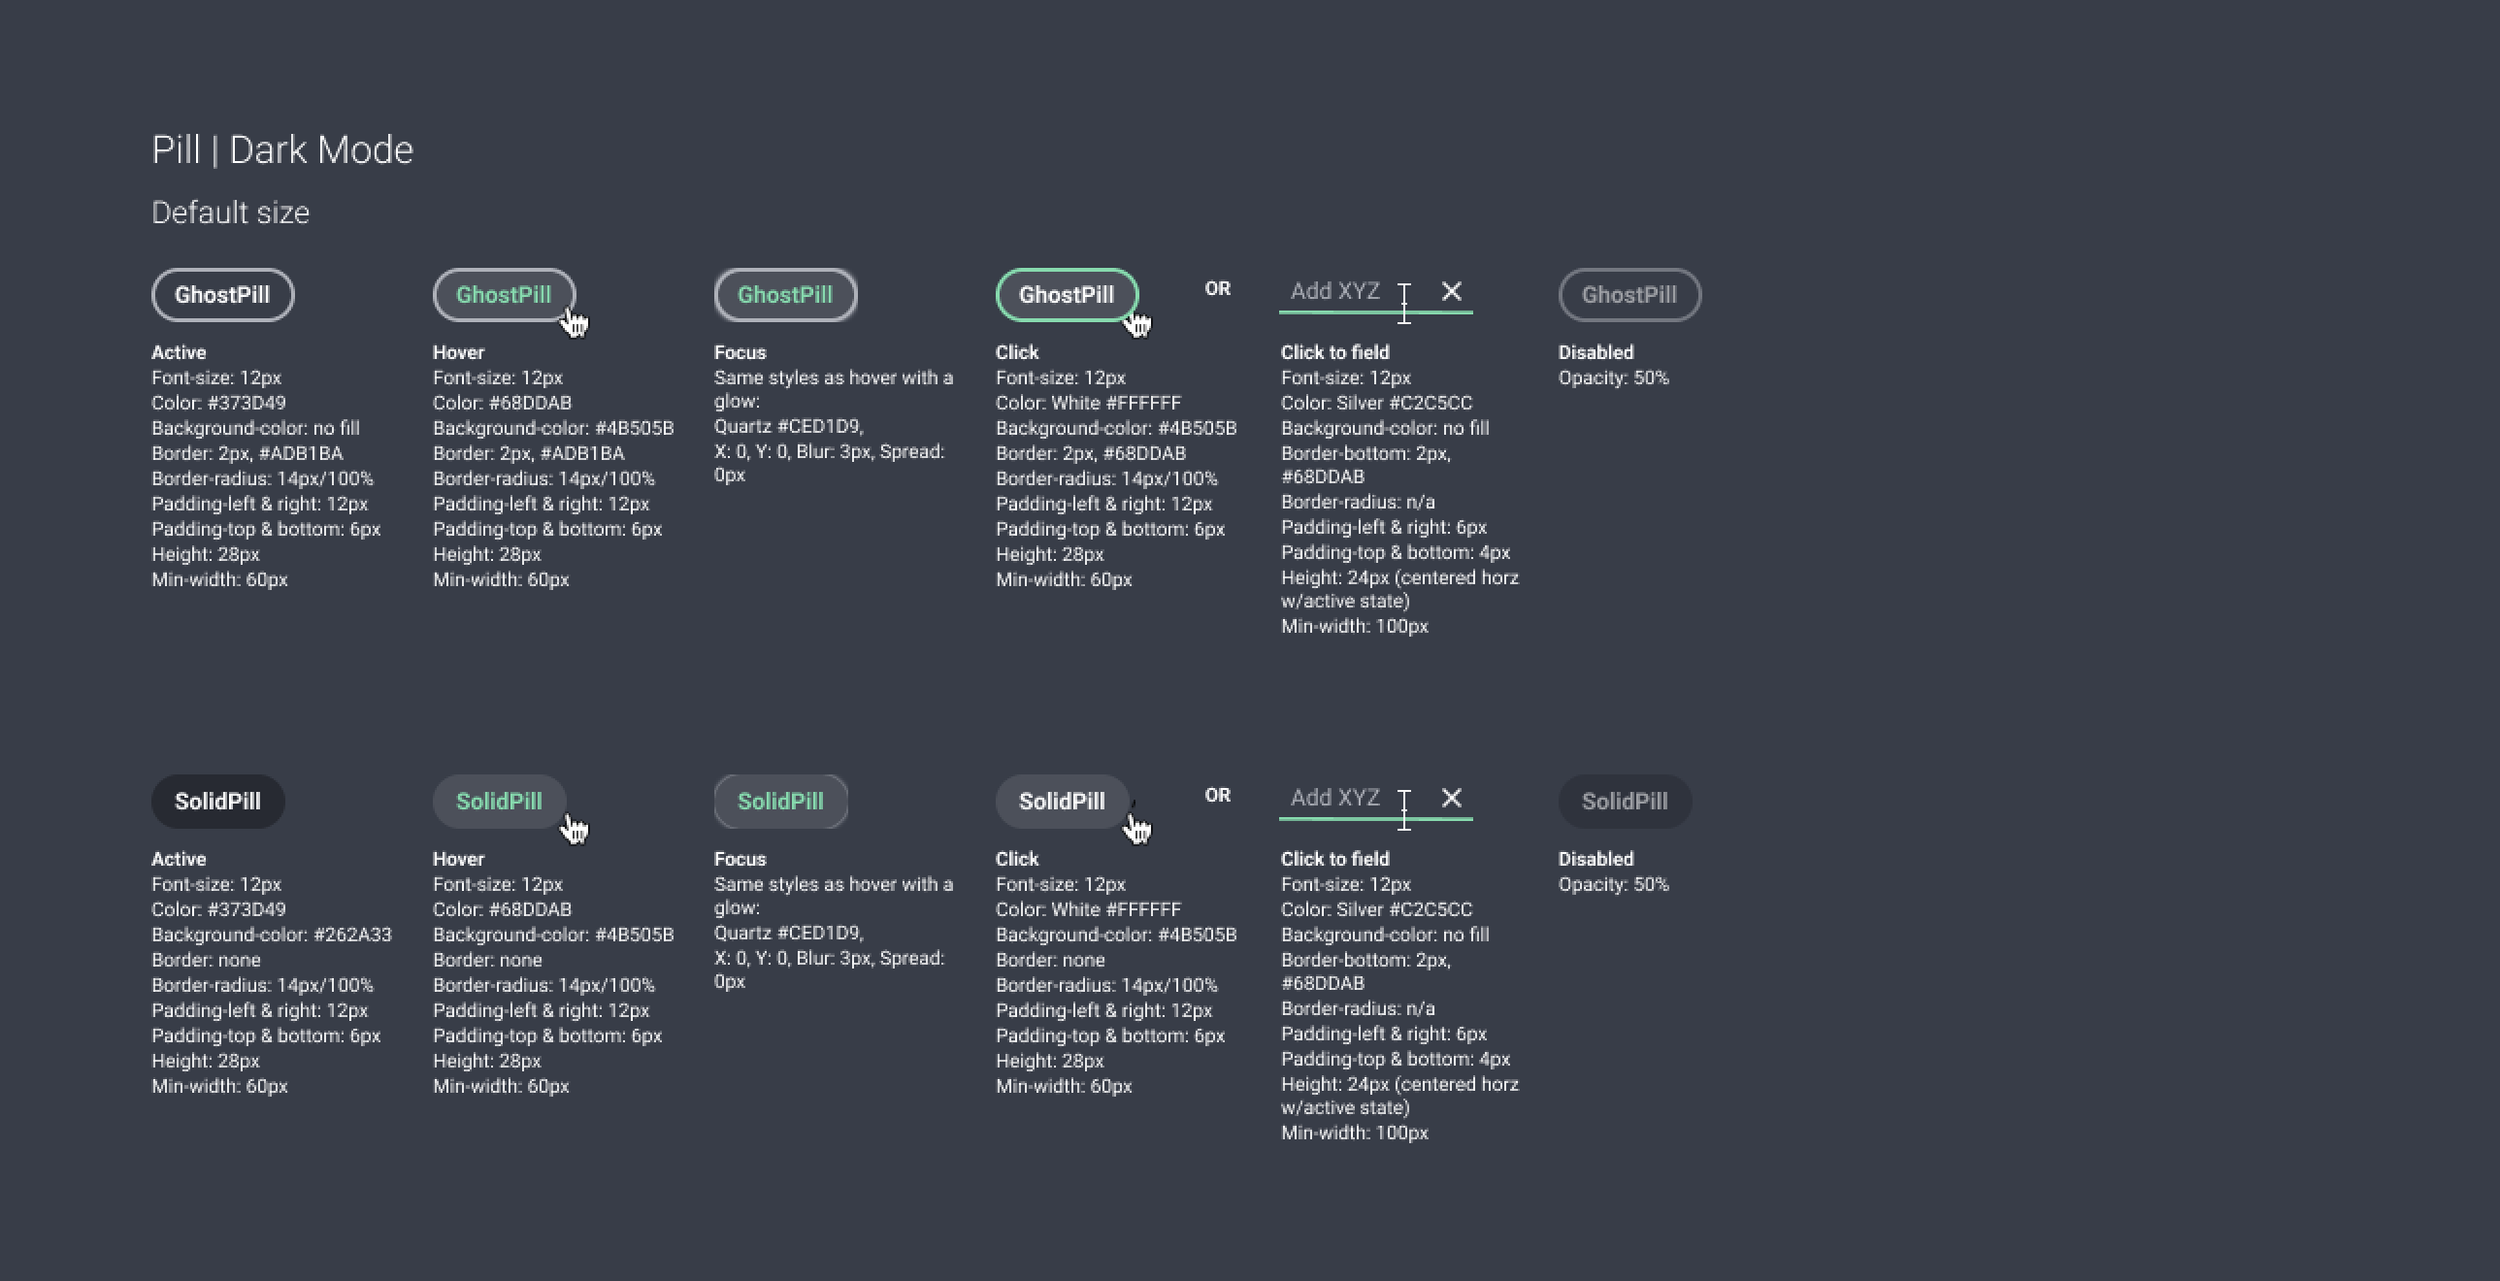
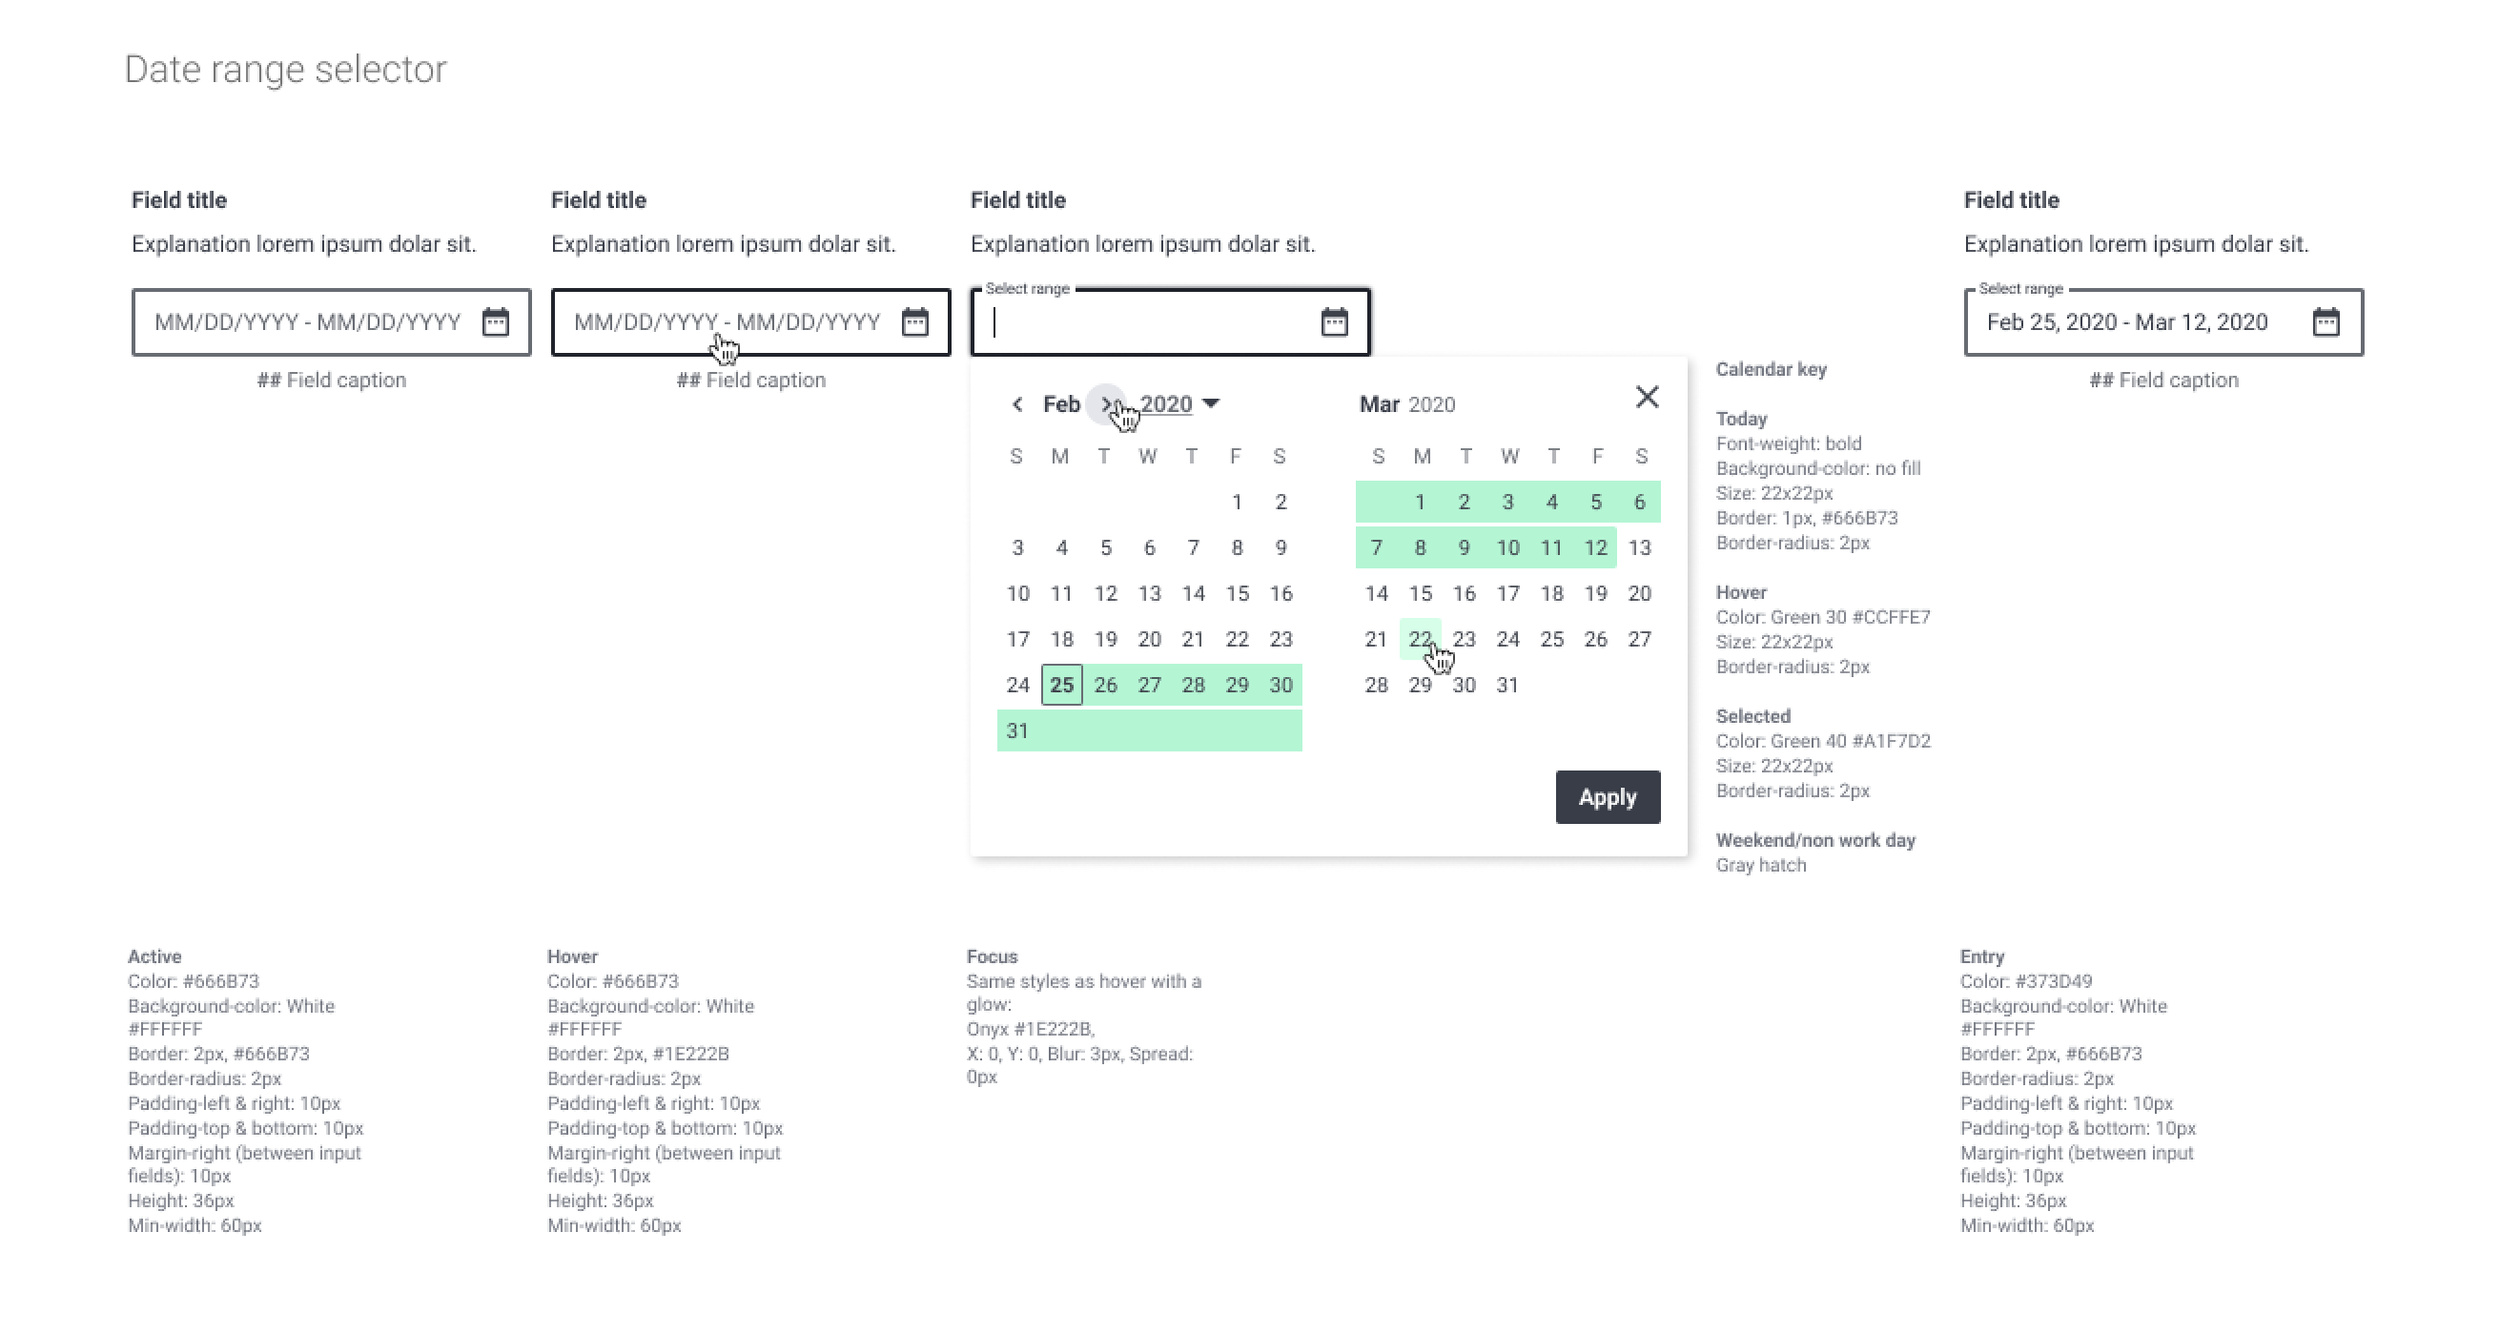
Style Guide
We designed an in-depth style guide in Sketch which we later transitioned to Figma.
User Archetypes
We validated our assumptions around archetypes in user interviews with customers.
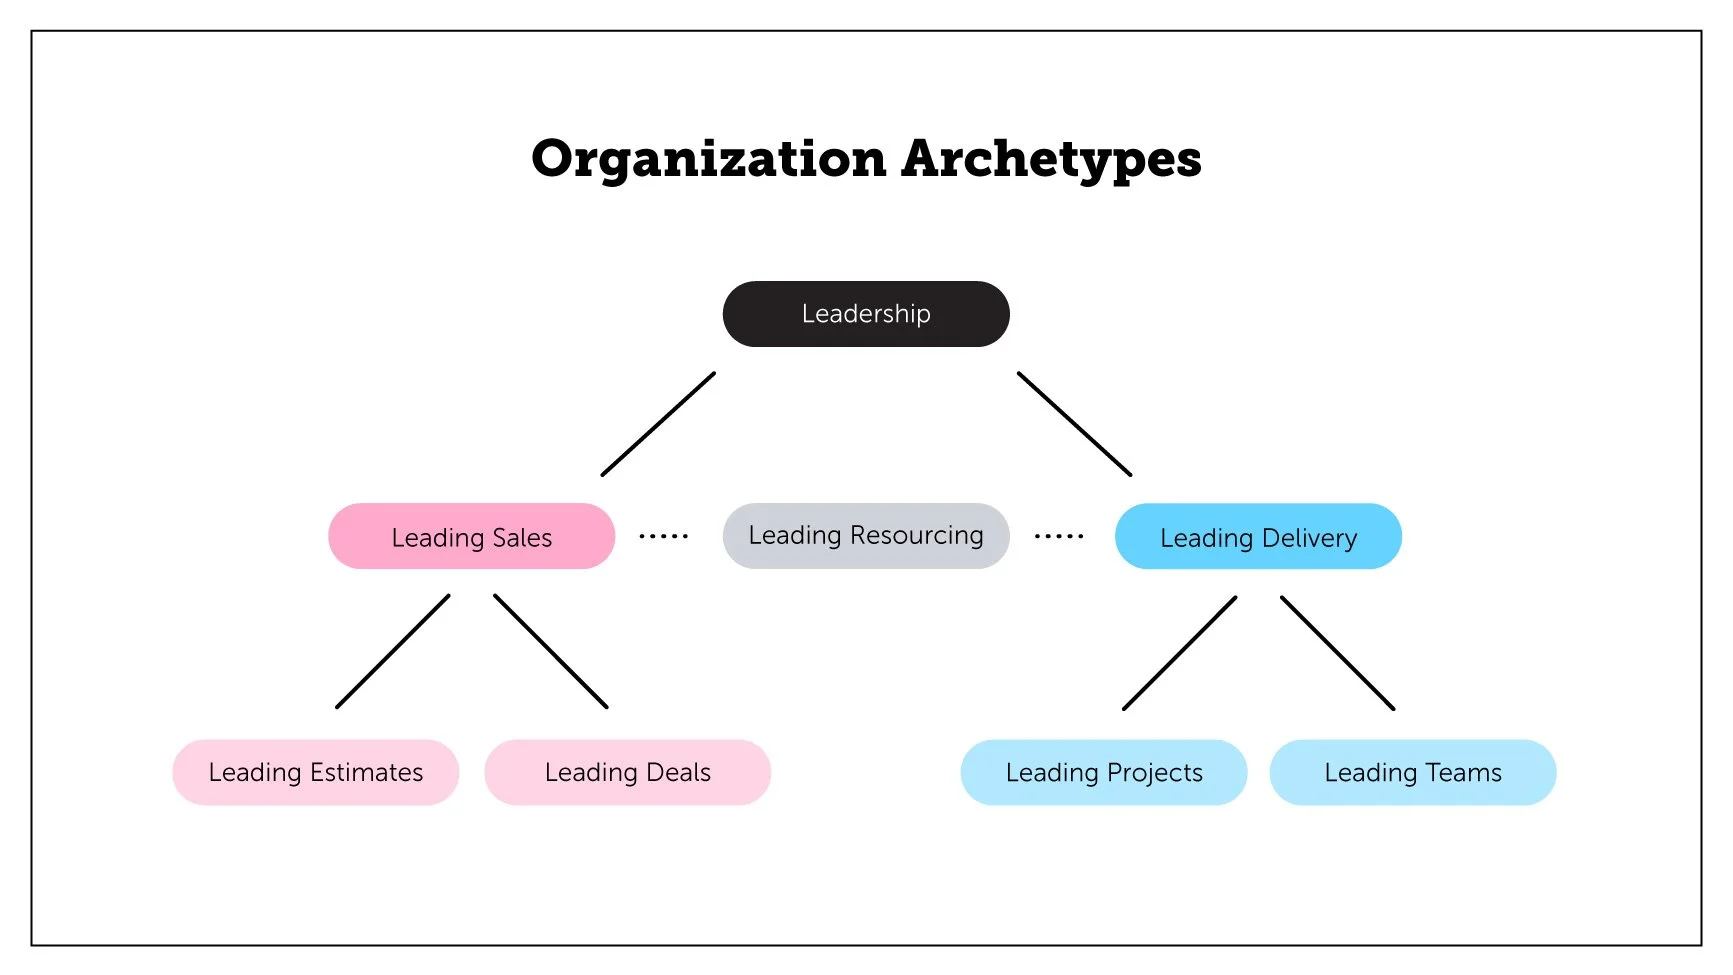
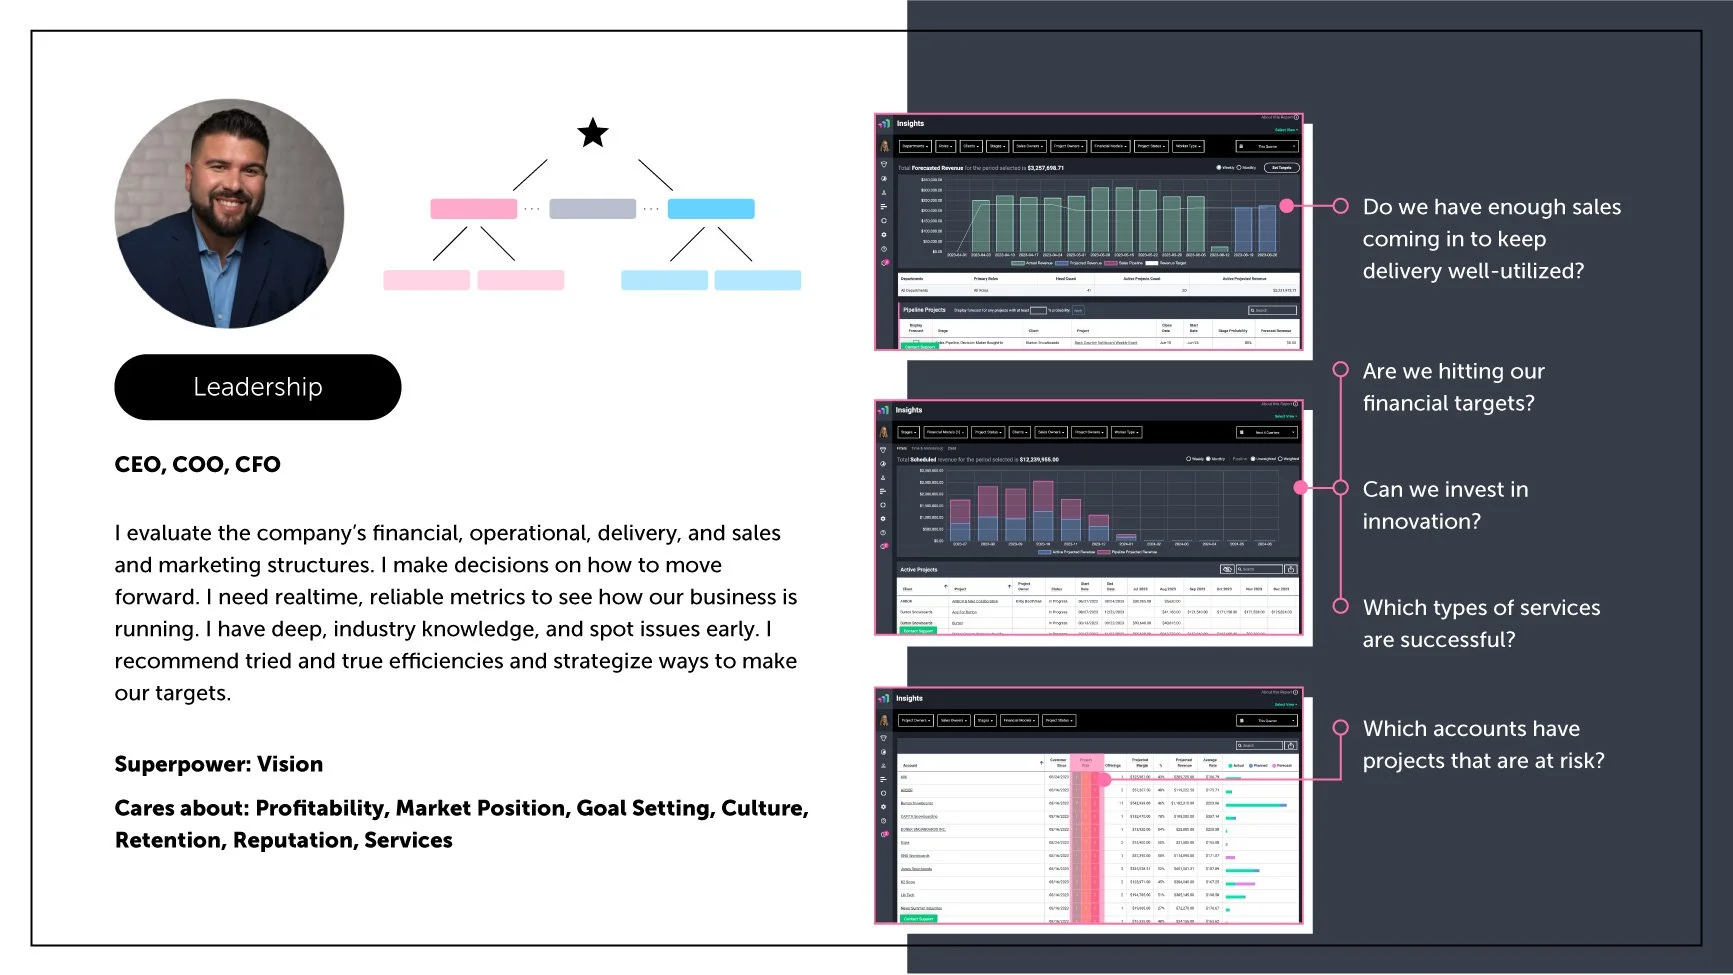
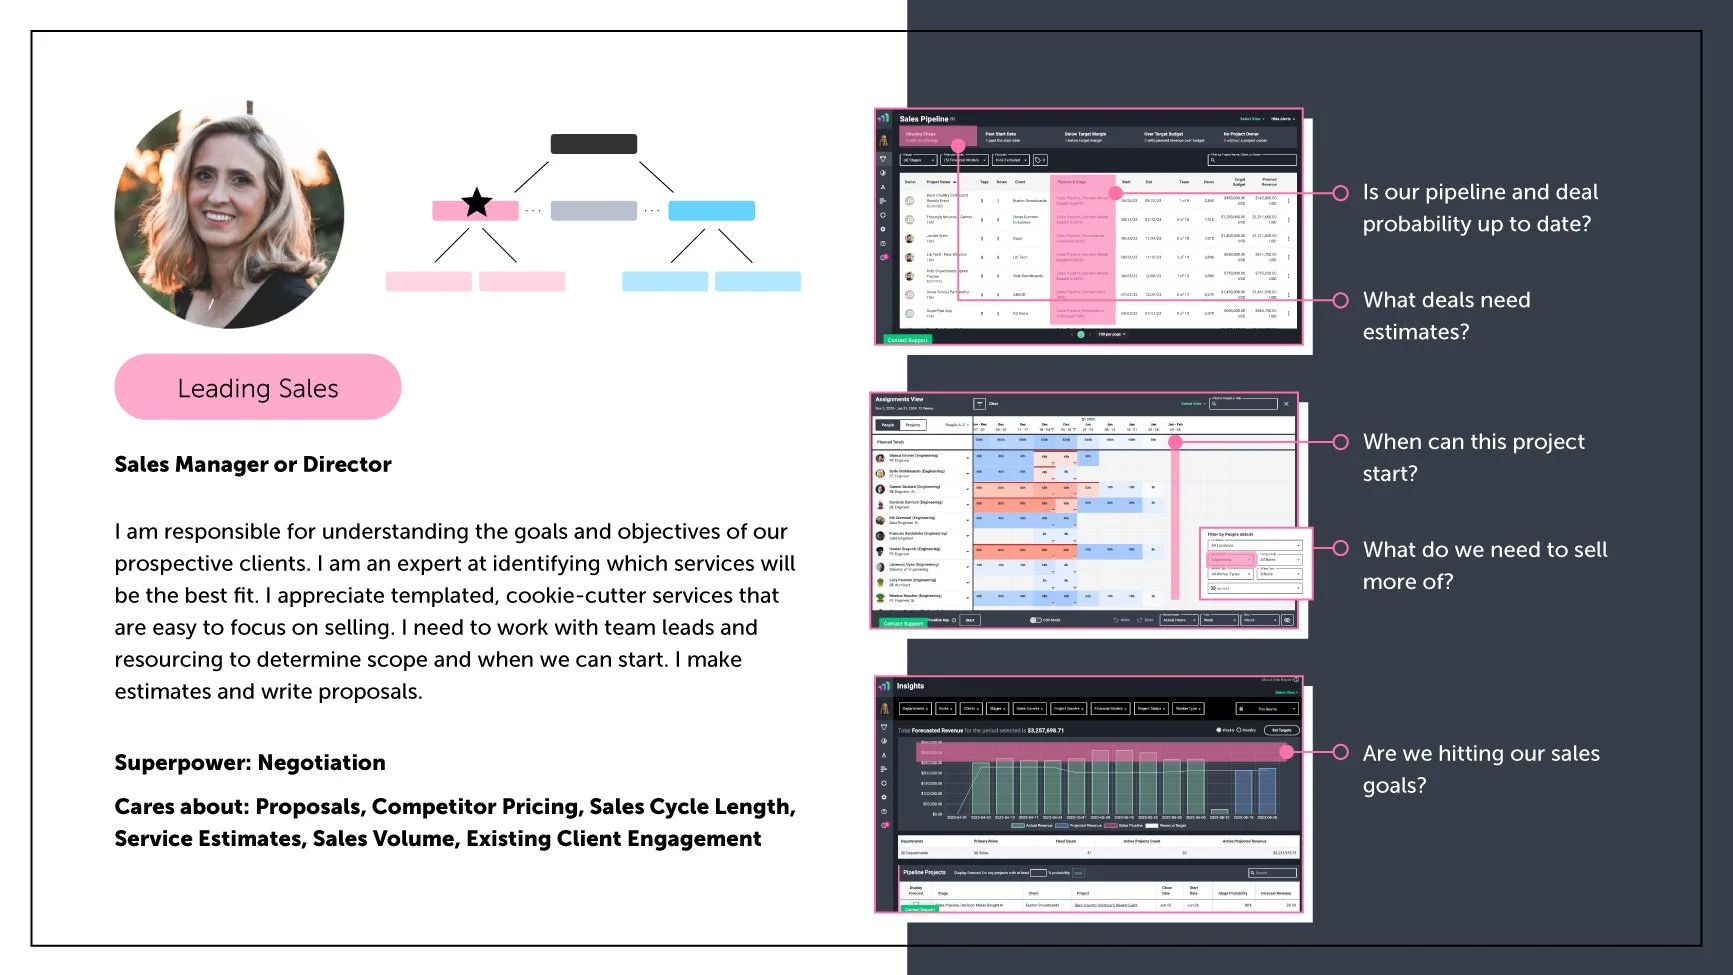
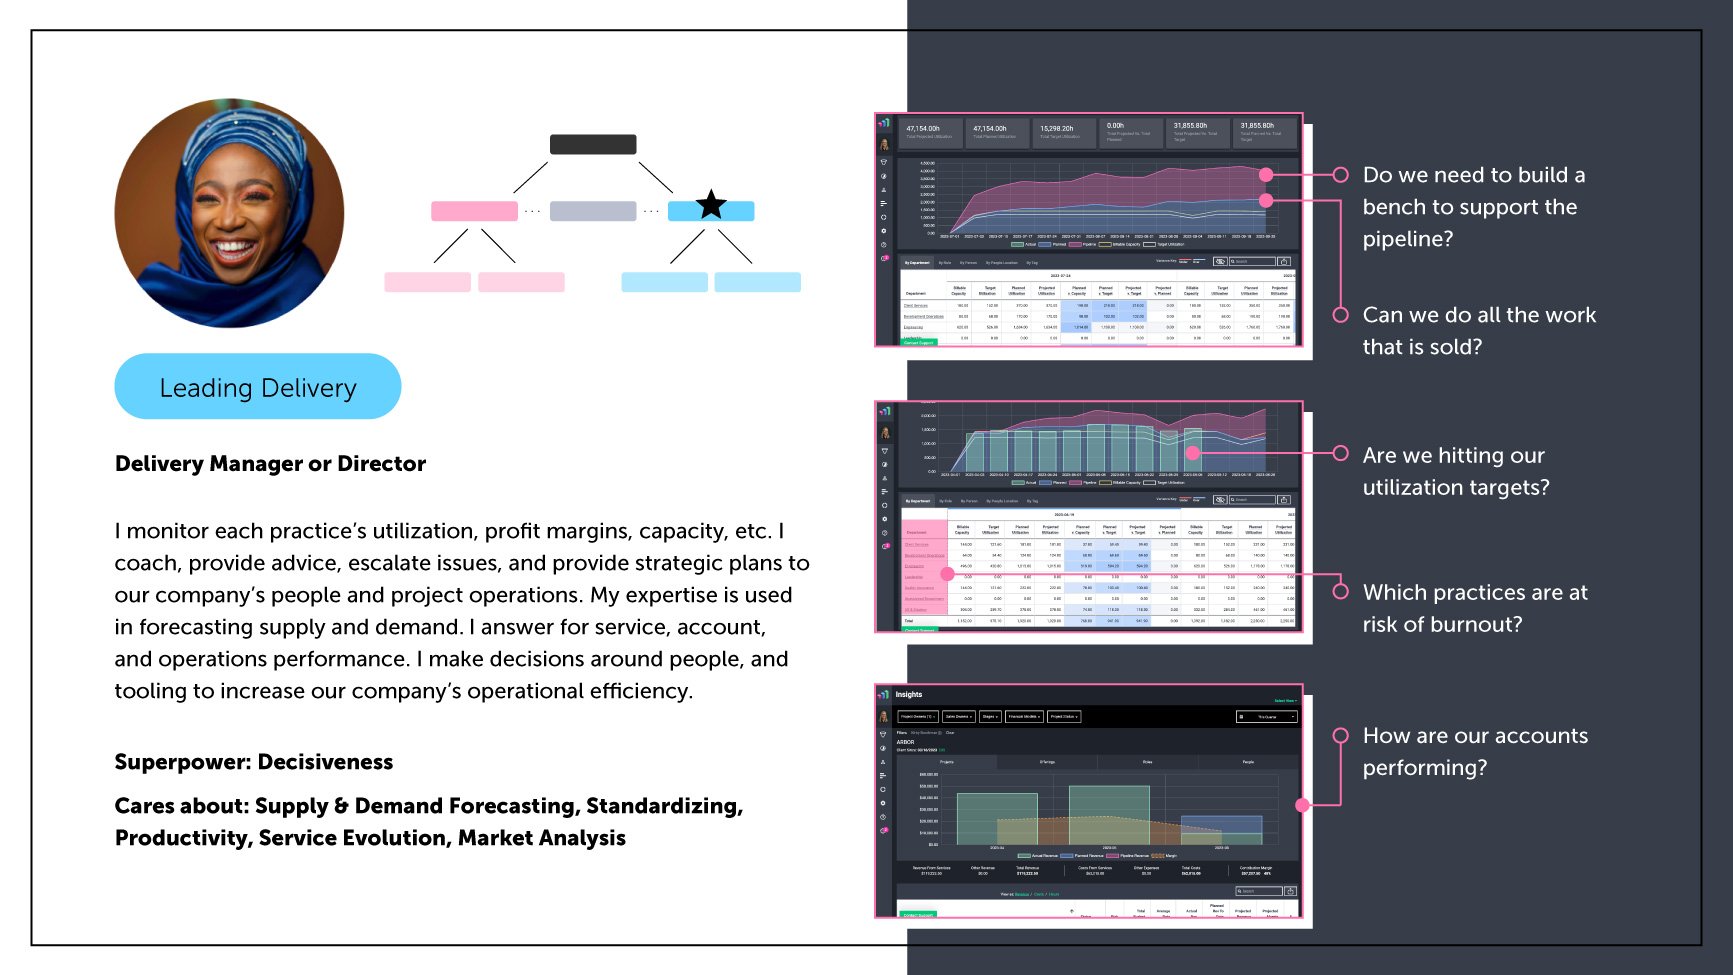
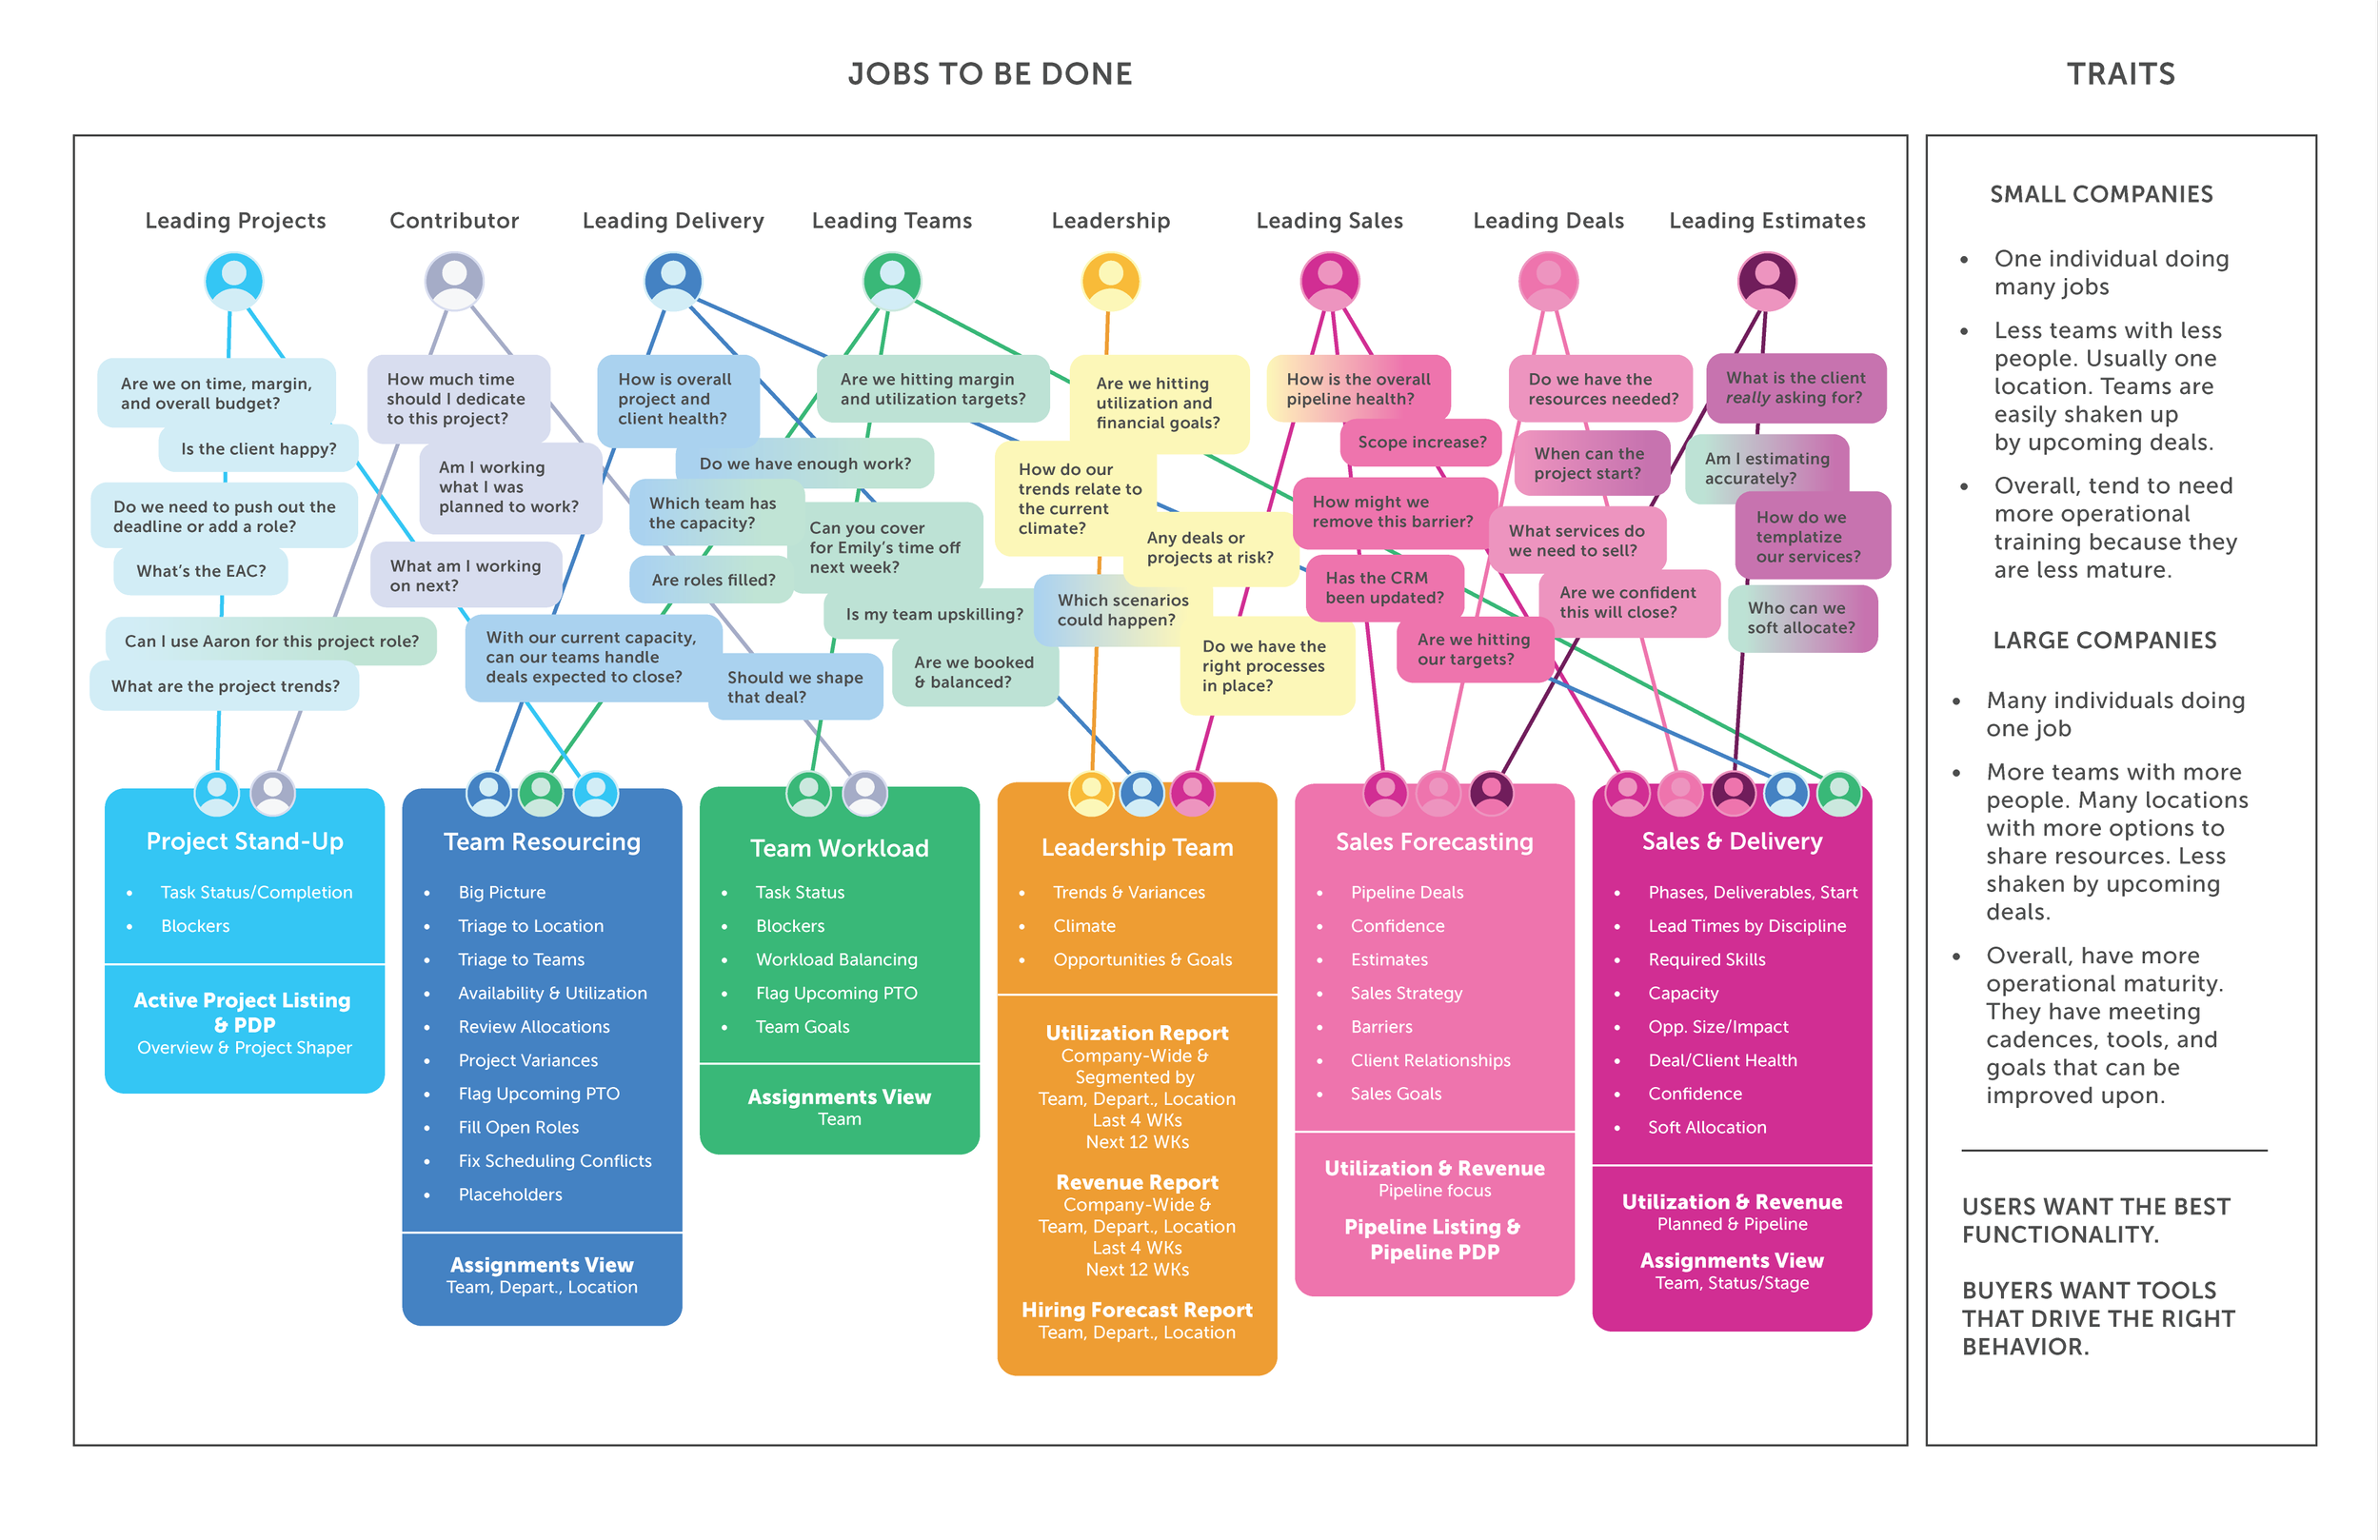
Over the years, we’ve become familiar with our primary users and what they seek in Parallax.
The biggest struggles our users face are related to repetitive workflows like onboarding, performance (perceived and load times), and what data is needed in one view to make decisions confidently. The more we can simplify and explain, the better.
PRODUCT VISION STORYTELLING
The challenges that our agency customers face are like mountains to be conquered.
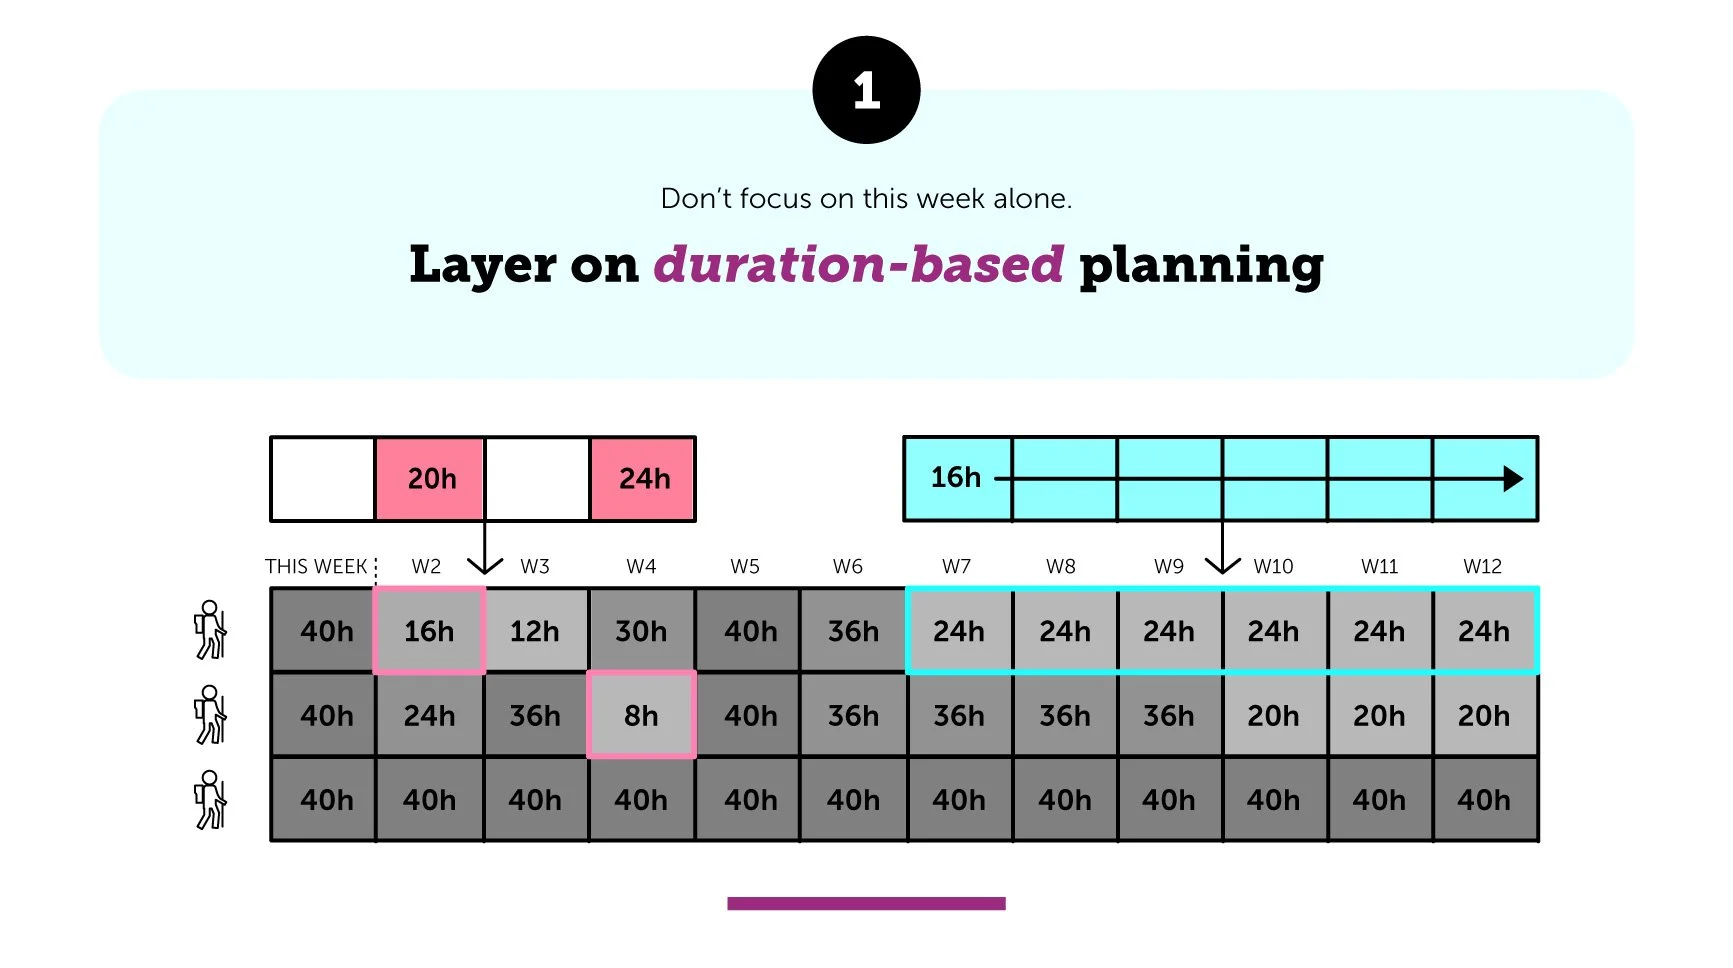
We’ve heard from prospects and customers that project and resourcing managers get caught up in the problems of today.
They deal with overbookings, time off, and budget burn at the last minute.
If they layered on low-fidelity, duration-based plans a few months out, they could stop fires before they start.
Parallax outfits your team with a map (resource plan) and binoculars (forecasts) to help you look ahead.
By forming new habits, managers can keep the project on track.
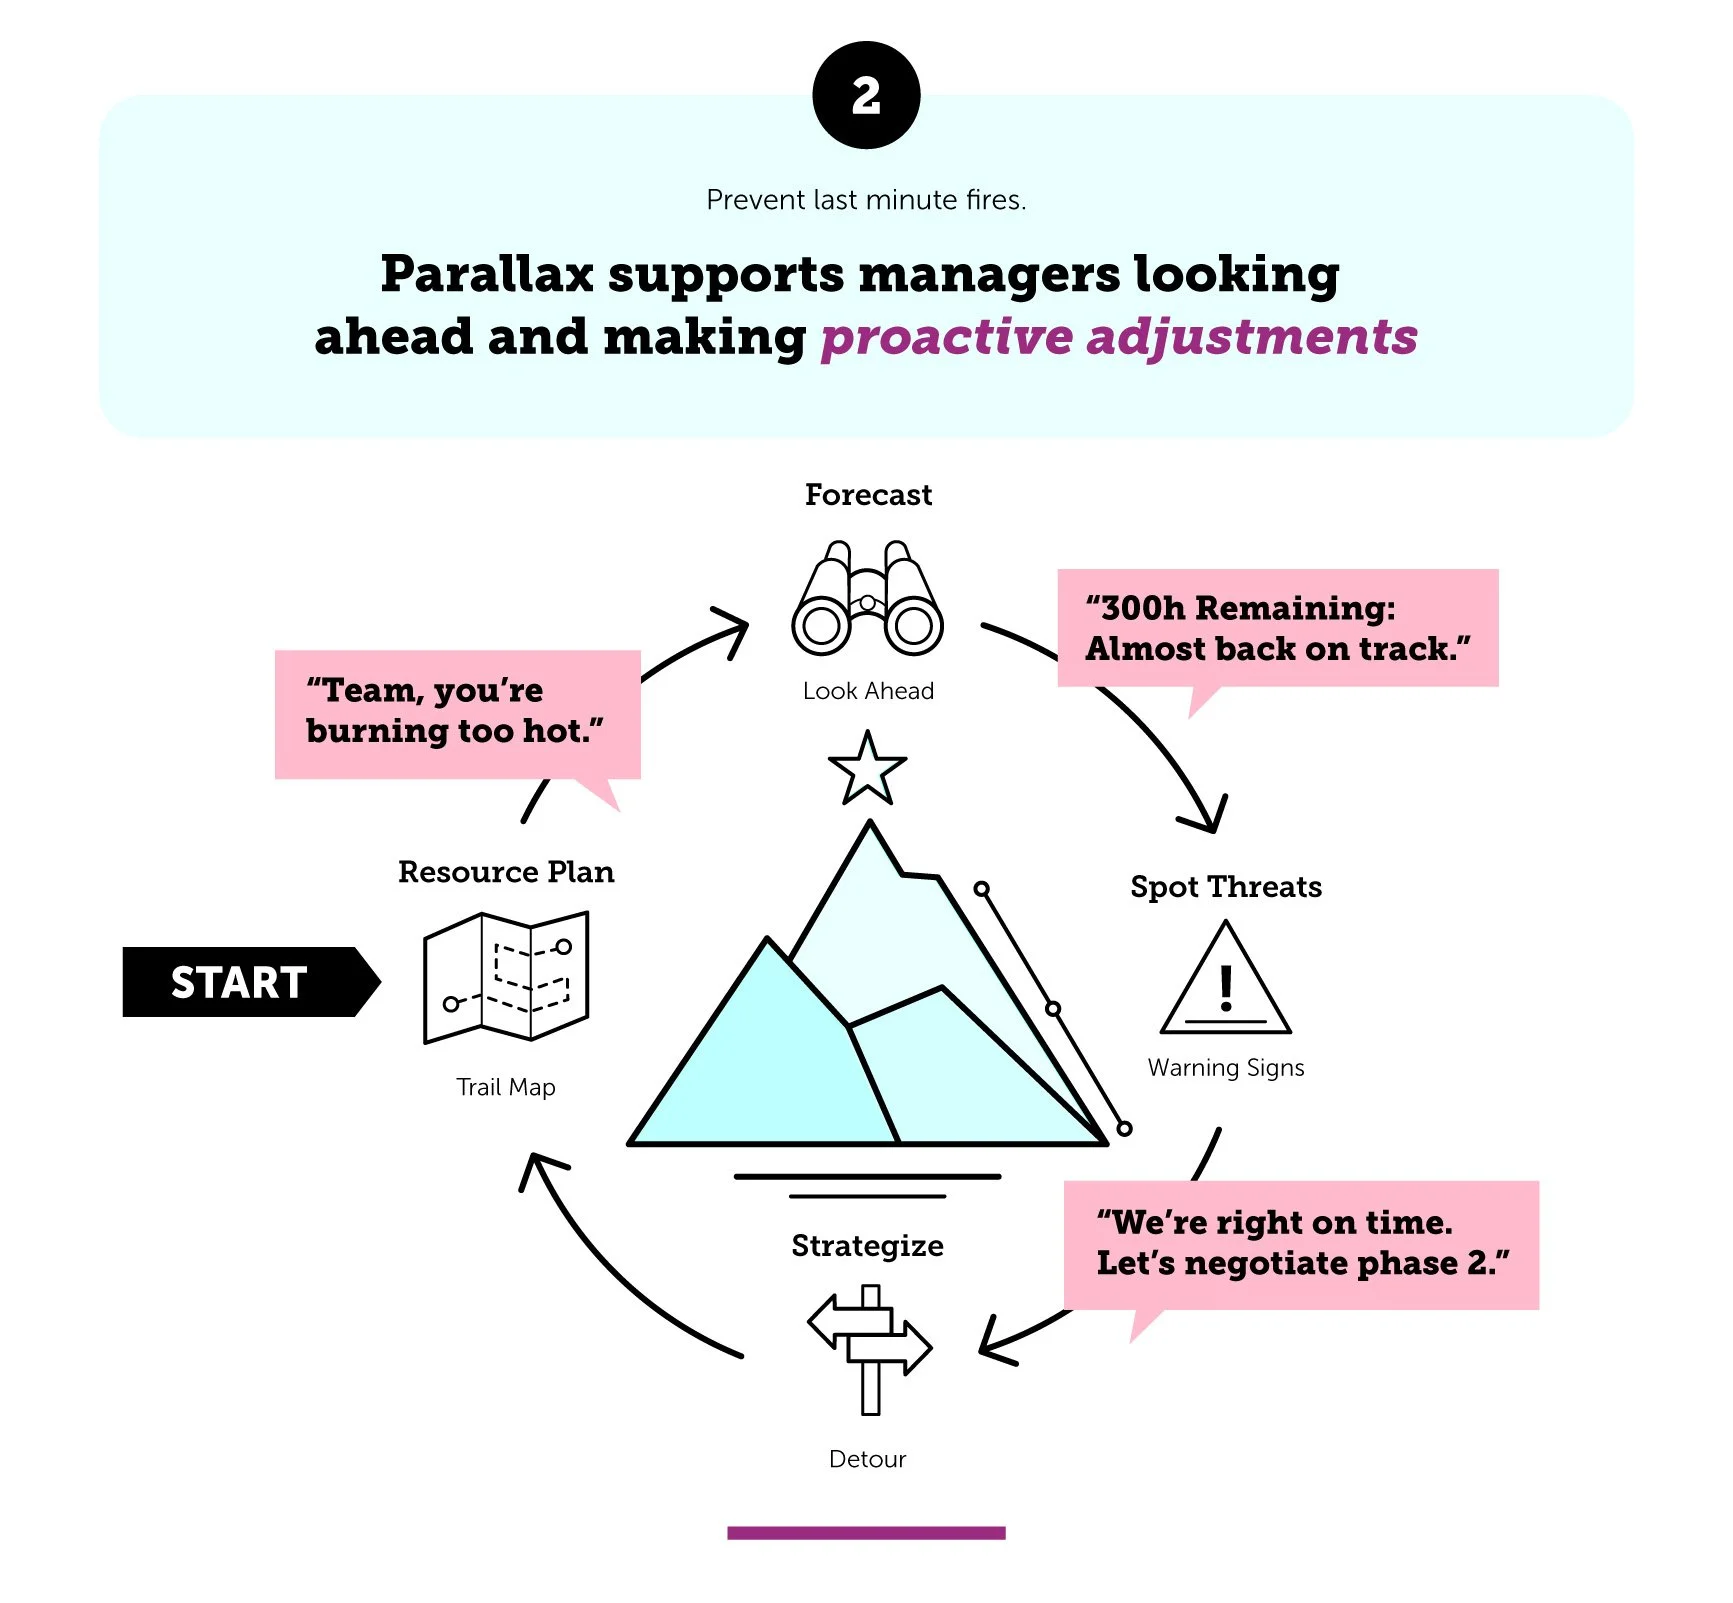
This shifts the culture from putting out daily fires to investing time in innovation.

ProDUCT NEW FEATURES
The enhancements below introduce customizable views, allowing users to complete old roles and offerings, edit saved views, and reorder items through a drag-and-drop feature. This spreadsheet-like experience simplifies data management and personalization, leading to a more intuitive user experience. These improvements align with company goals by boosting user satisfaction, increasing ROI for customers through optimized workflows, and fostering greater adoption of Parallax's features.
Drag-and-Drop Roles & Offerings
Completing an Offering or Role
Edit a Saved View
Implementation & Onboarding Project
Now that we have a vision, archetypes, and styles, we can improve our onboarding experience.
Business automation products are complex and require a lot of data from multiple sources. Parallax is already considered a quick win in the PSA market. PSA (Professional Service Automation) tools can take over a year to implement. This is because various departments are forced to roll off current tools for time and expense tracking, invoicing, project management, and talent management. At Parallax, we integrate with their tools so they don’t need to deal with a lengthy transition to a sub-par tech stack.
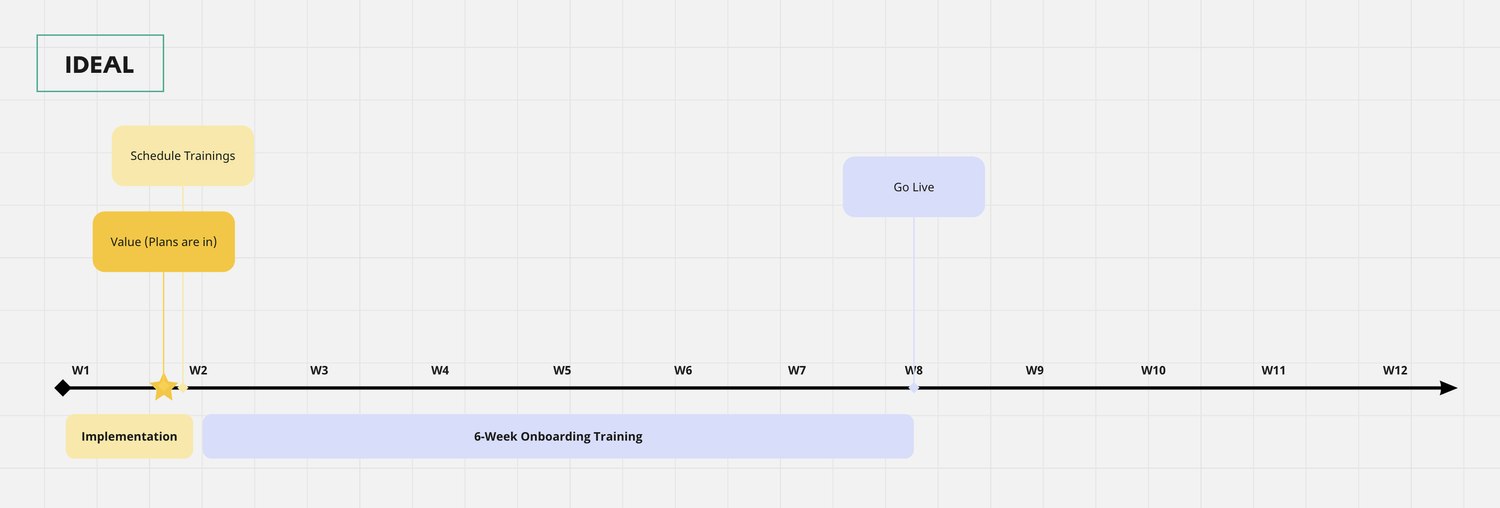
Even though we run a faster implementation and onboarding experience than our competitors, our goal is to reduce the customer’s time-to-value.
Our current experience has implementation running for 4 weeks and we estimated the time-to-value at 9 weeks.
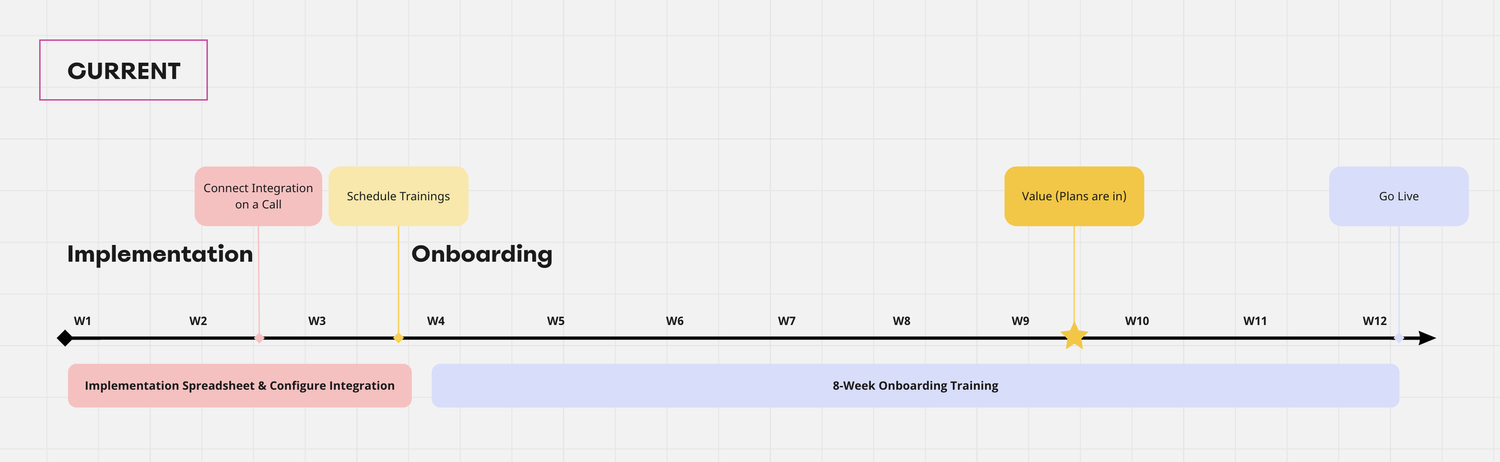
Ideally, we get customers is in the system and seeing value within the first week.
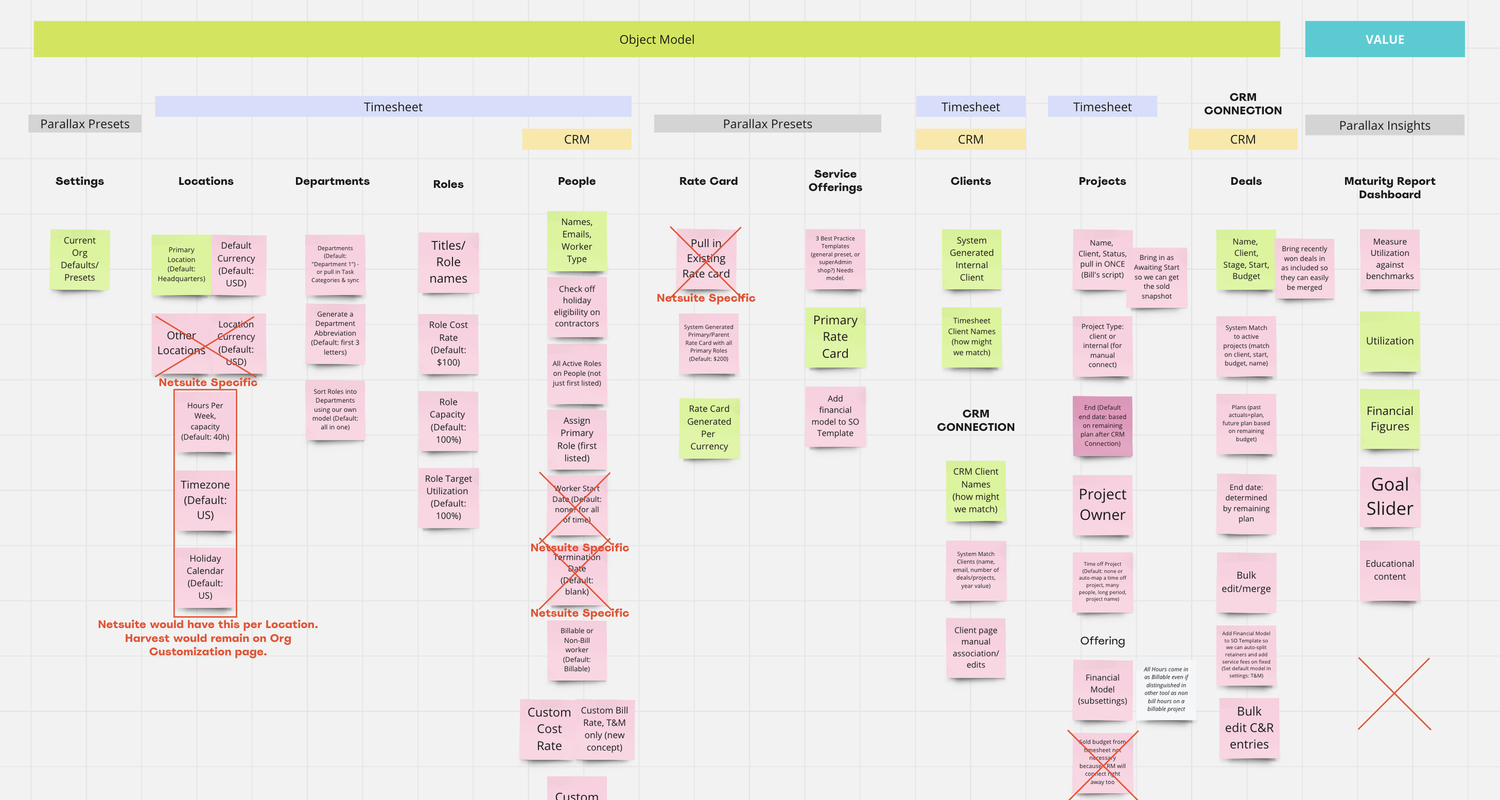
In order to do this, we needed to focus on a few key steps of the implementation process.
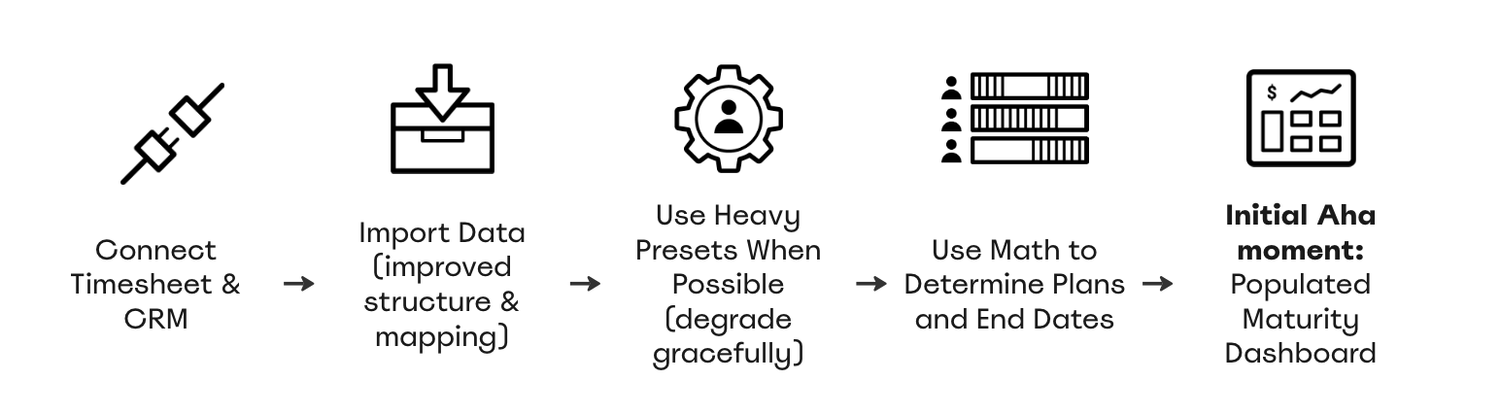
Within these few steps, we were still able to brainstorm solutions and refine.
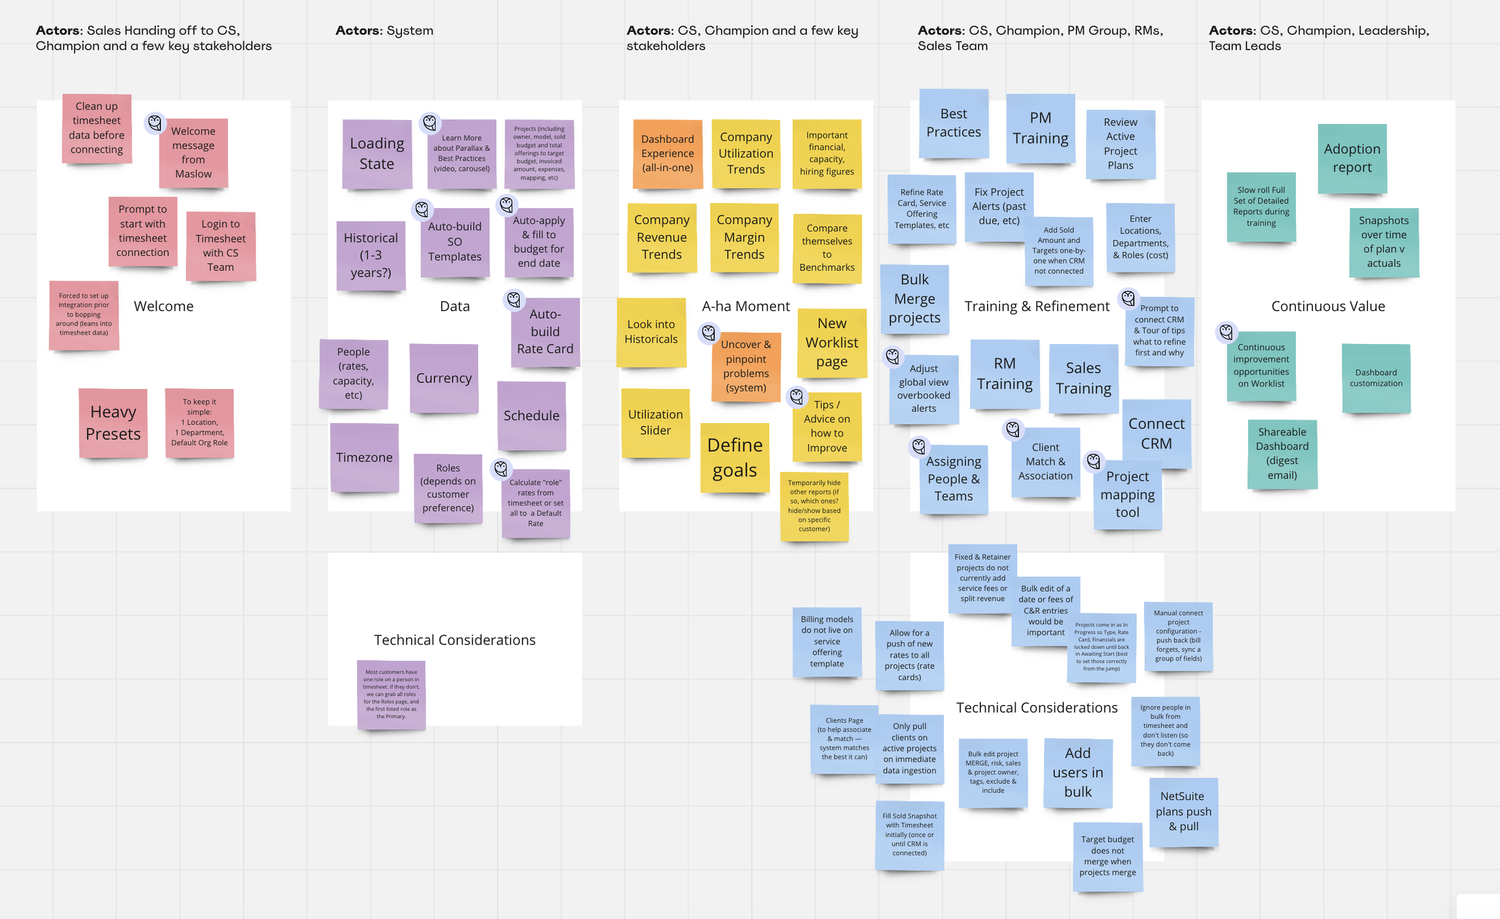
We put together a story map — the pink post-its were our gaps or opportunities.
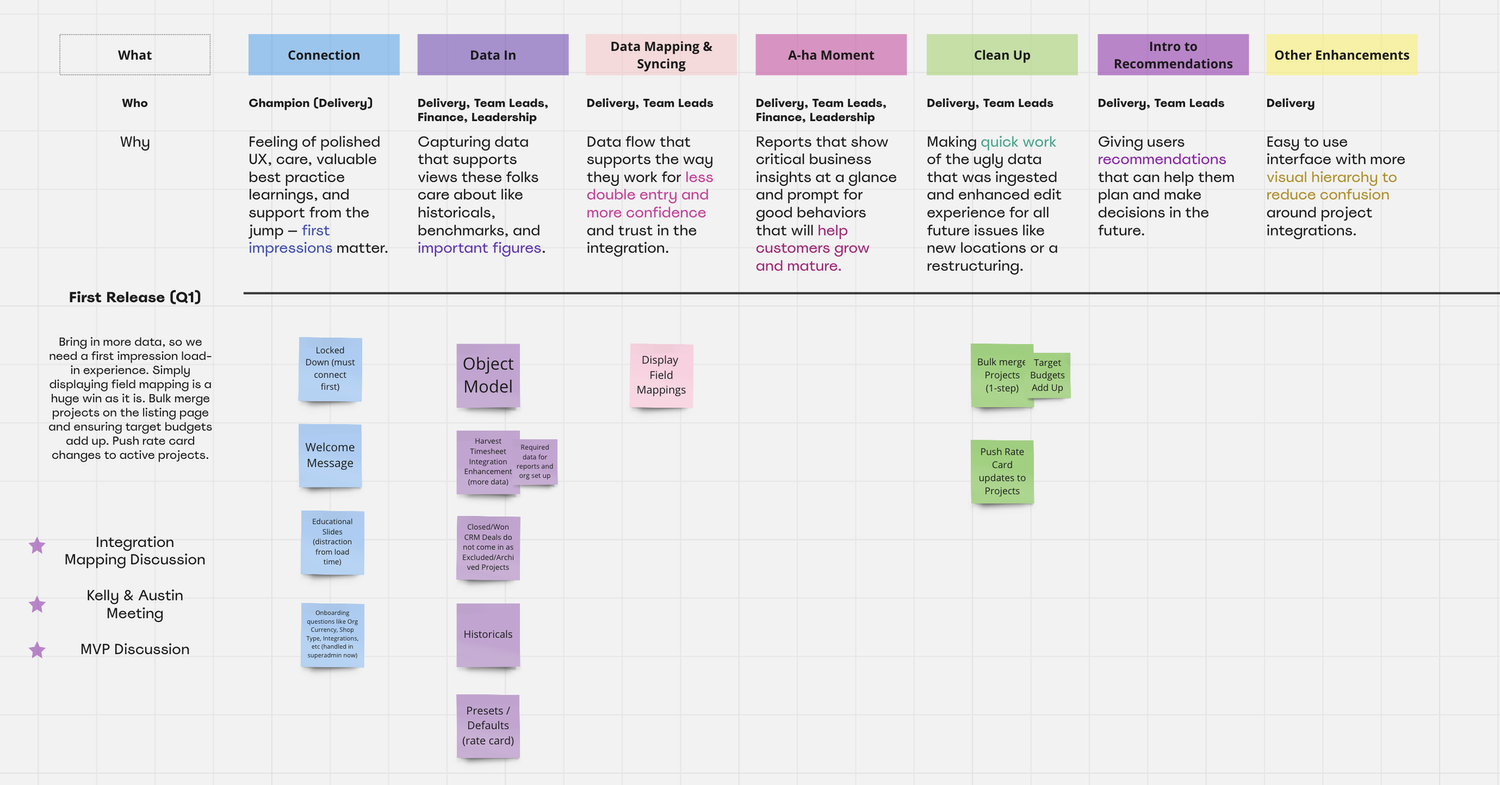
From there, we broke it down into our top priorities for the first release.
We considered who this would benefit and why they needed the feature or enhancement.
Concepts
Maturity Dashboard
Adoption Report
In the end, we recommended a more intuitive and user-friendly experience through a welcome message, educational training slides, pulling in more data from the integration, a maturity dashboard, and an adoption report. This provides the user with an analysis of their data right away and gives them a guide to adopting the tool. With these reports, we hypothesized that our customers would be delighted at week 1.
Team
UX Lead: Jamie Braith
Senior UX Design: Sam Hoglund
Head of Product: Jacob Ward